Calculator App With Waterfall Chart
Anyone who knows me knows that I Iove a good chart. So it was a natural, and fun, next addition to my Crafting Profit Calculator. Adding these charts packs in a ton of information into this small and very simple tool – and it was a great excuse to play with Google’s Visualization API.
Some of you may recall the Craft Profit Calculator I created for my wife last year. It’s very simple web app I use occasionally to try out new ideas; initially created to play with HTML5. I released a new version today. It has a few new features, but the one I want to call out initially is the waterfall charts.
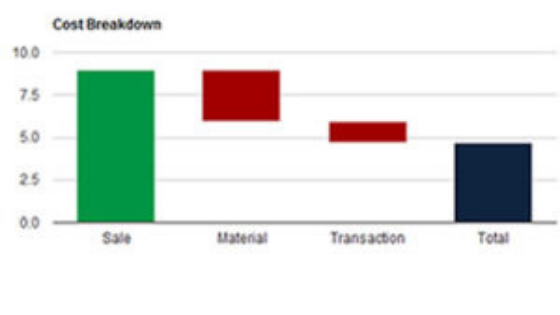
The waterfall charts are created using Google Visualization API bar charts. I got the scripts from my friend and coworker, Josh at data-ink.com. Here is his original post that illustrates how this is done:
This is a very elegant solution he came up with and was a perfect fit for what I needed in this case. It's HTML5 and HTML4 compatible and looks great on the iPhone/iPad. Check out the calculator and his post. If you like this, I would suggest following Josh’s data visualization blog. He posts cool stuff like this all the time. He recently posted a gantt chart technique, and I am wrecking my brain just to invent a reason to use it.